IELTS Academic Writing Task 1
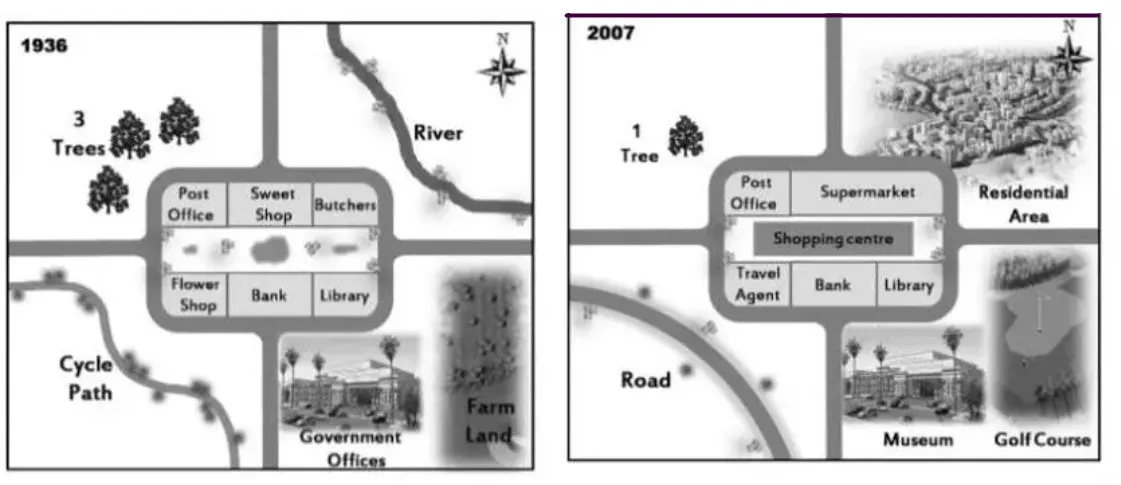
The maps below shows the town of Lynnfield in 1936 and then later in 2007.
Summarise the information by selecting and reporting the main features and make comparisons where relevant.
Things you should know about Academic Writing Task 1:
- You are asked to describe information presented in graph/ table/ chart/ diagram.
- You have 20 minutes to finish the task and you have to write at least 150 words.
- If you are asked to use the information presented in the graph you must be careful not to copy it.
In Academic Writing task 1, candidates are assessed on their ability to:
- Organise, present and possibly compare data.
- Describe the stages of a process or procedure.
- Describe an object or event or sequence of events.
- Explain how something works.
Model Answer
The maps illustrate the main changes in Lynnfield between 1936 and 2007.
Overall, it is apparent that the town became more residential, commercial, and accessible(can be travelled to easily) at the expense of natural land, agriculture and smaller shops.
The most notable changes in 1936 were rivers northeast of the post office, surrounded by trees, and pristine land. By 2007, the number of trees had declined and the land around the river was becoming a residential area. To the southwest of the city, bicycle lanes have been converted into a motorway, and on the other side of the city’s south-eastern map, government agencies and farmlands were once converted into museums, each with a golf course.
Furthermore, in the centre of town, there was a line of post offices, confectionery stores, butcher shops, and an alley that separated these stores from florists, banks, and libraries. In 2007, only banks (slightly expanded), libraries and post offices remained untouched. The flower shop was converted into a travel agency that was once the centre of downhill square and replaced by a large shopping mall.
Read More :
- The Maps below show Pancha Village in 2005 and 2015
- The diagram below describes the structure of a home smokery and how it works
- The bar chart illustrates the percentage of businesses in the UK who had a social media presence
- The line chart below shows the changes that took place in three different areas of crime in New Port
- The plans below show the site of a mining town in the past and redevelopment in the present day
The maps below shows the town of Lynnfield in 1936 and then later in 2007

The maps illustrate the main changes in Lynnfield between 1936 and 2007.
Overall, it is apparent that the town became more residential, commercial, and accessible(can be travelled to easily) at the expense of natural land, agriculture and smaller shops.
The most notable changes in 1936 were rivers northeast of the post office, surrounded by trees, and pristine land. By 2007, the number of trees had declined and the land around the river was becoming a residential area. To the southwest of the city, bicycle lanes have been converted into a motorway, and on the other side of the city’s south-eastern map, government agencies and farmlands were once converted into museums, each with a golf course.
Furthermore, in the centre of town, there was a line of post offices, confectionery stores, butcher shops, and an alley that separated these stores from florists, banks, and libraries. In 2007, only banks (slightly expanded), libraries and post offices remained untouched. The flower shop was converted into a travel agency that was once the centre of downhill square and replaced by a large shopping mall.


