IELTS Academic Writing Task 1
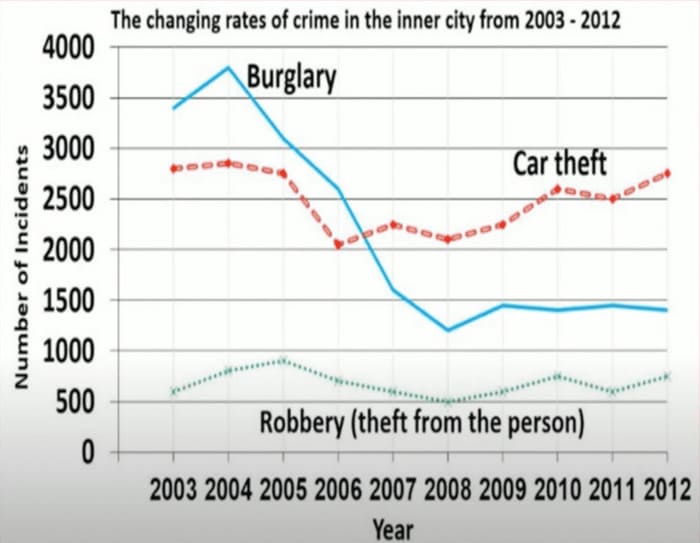
The line chart below shows the changes that took place in three different areas of crime in New Port.
Summarise the information by selecting and reporting the main features and make comparisons where relevant.
Things you should know about Academic Writing Task 1:
- You are asked to describe information presented in graph/ table/ chart/ diagram.
- You have 20 minutes to finish the task and you have to write at least 150 words.
- If you are asked to use the information presented in the graph you must be careful not to copy it.
In Academic Writing task 1, candidates are assessed on their ability to:
- Organise, present and possibly compare data.
- Describe the stages of a process or procedure.
- Describe an object or event or sequence of events.
- Explain how something works.
Model Answer
The line chart depicts variation in levels in three major crimes named robberies, car thefts, and burglaries from 2003 to 2012 in New Port city centre.
Overall, it is readily apparent that burglaries declined significantly and were replaced as the most common crime by car thefts, which fell slightly overall. Robberies were least common throughout but remained constant.
In 2003, burglaries were prevalent at a rate of nearly 3400. This number then peaked at 3,750 the next year. In the next 4 years, the figures dropped considerably to a nadir of 1,100 in 2008 and generally remained around this level until the end of the period. In contrast, car thefts began the period lower with 2,800, dipped to 2000 in 2006 and increased with minor fluctuations to 2,750 by 2012.
Furthermore, The least common crime was robbery. Statistics showed just over 500 robberies in 2003, and incidences remained under 1000 the whole time, ending at 750 in 2012.
Read More :
- The plans below show the site of a mining town in the past and redevelopment in the present day
- The chart below shows what Anthropology graduates from one university did after finishing their undergraduate degree courses
- The diagram below shows the production of steam using a gas cooled nuclear reactor
- The chart below show a percentage of five kinds of books sold bookseller
- The chart below show changes in the proportion of energy produced from different resources in a country in 1985 and 2003
The plans below show the site of a mining town in the past and redevelopment in the present day.

The line chart depicts variation in levels in three major crimes named robberies, car thefts, and burglaries from 2003 to 2012 in New Port city centre.
Overall, it is readily apparent that burglaries declined significantly and were replaced as the most common crime by car thefts, which fell slightly overall. Robberies were least common throughout but remained constant.
In 2003, burglaries were prevalent at a rate of nearly 3400. This number then peaked at 3,750 the next year. In the next 4 years, the figures dropped considerably to a nadir of 1,100 in 2008 and generally remained around this level until the end of the period. In contrast, car thefts began the period lower with 2,800, dipped to 2000 in 2006 and increased with minor fluctuations to 2,750 by 2012.
Furthermore, The least common crime was robbery. Statistics showed just over 500 robberies in 2003, and incidences remained under 1000 the whole time, ending at 750 in 2012.


