IELTS Academic Writing Task 1
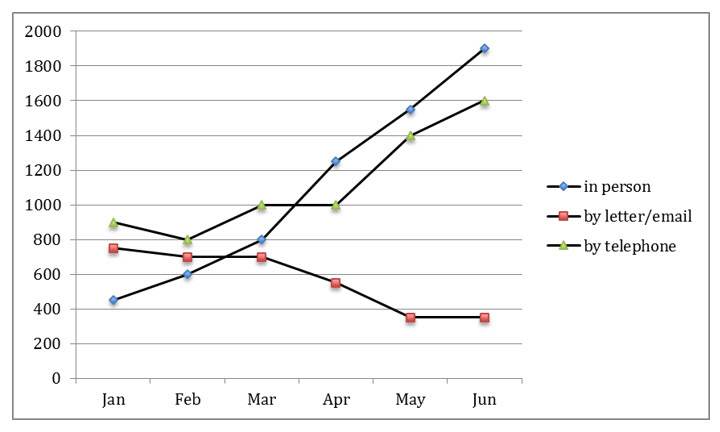
The chart shows requests for information at a tourist office in the United Kingdom from January to June.
Summarise the information by selecting and reporting the main features and make comparisons where relevant.
Things you should know about Academic Writing Task 1:
- You are asked to describe information presented in graph/ table/ chart/ diagram.
- You have 20 minutes to finish the task and you have to write at least 150 words.
- If you are asked to use the information presented in the graph you must be careful not to copy it.
In Academic Writing task 1, candidates are assessed on their ability to:
- Organise, present and possibly compare data.
- Describe the stages of a process or procedure.
- Describe an object or event or sequence of events.
- Explain how something works.
Model Answer
A line chart depicts the number of inquiries received by the British Tourist Board during the first six months of a given year. Information is divided into his three sections: Personal Inquiries, Letters/Emails, and Phone Calls.
Overall, it is readily apparent that face-to-face inquiries were the most common during this period, overtaking telephone, which also rose. In contrast, requests for information by email or letter decreased and were the rarest at the end of the study period.
At the beginning of the first month, personal information requests were the lowest of all three categories at about 420, while written requests and phone calls were at 770 and 900 respectively. In March, personal questions (800) exceeded letter/email requests by 100. Personal questions were on the rise, peaked at 1,900 and ending the period.
In contrast, telephone inquiries remained at 1,000 for about a month from March to April. The numbers were growing exponentially, finishing just behind 1,600 personal inquiries. Letter and email requests, on the other hand, remained the same (700) for a month from May to June before dropping sharply to 400.
Read More :
- The Town of Lynnfield in 1936 and then later in 2007
- The Maps below show Pancha Village in 2005 and 2015
- The diagram below describes the structure of a home smokery and how it works
- The bar chart illustrates the percentage of businesses in the UK who had a social media presence
- The line chart below shows the changes that took place in three different areas of crime in New Port
The chart shows requests for information at a tourist office in the United Kingdom from January to June

A line chart depicts the number of inquiries received by the British Tourist Board during the first six months of a given year. Information is divided into his three sections: Personal Inquiries. Letters/Emails, and Phone Calls.
Overall, it is readily apparent that face-to-face inquiries were the most common during this period, overtaking telephone, which also rose. In contrast, requests for information by email or letter decreased and were the rarest at the end of the study period.
At the beginning of the first month, personal information requests were the lowest of all three categories at about 420, while written requests and phone calls were at 770 and 900 respectively. In March, personal questions (800) exceeded letter/email requests by 100. Personal questions were on the rise, peaked at 1,900 and ending the period.
In contrast, telephone inquiries remained at 1,000 for about a month from March to April. The numbers were growing exponentially, finishing just behind 1,600 personal inquiries. Letter and email requests, on the other hand, remained the same (700) for a month from May to June before dropping sharply to 400.


