IELTS Academic Writing Task 1
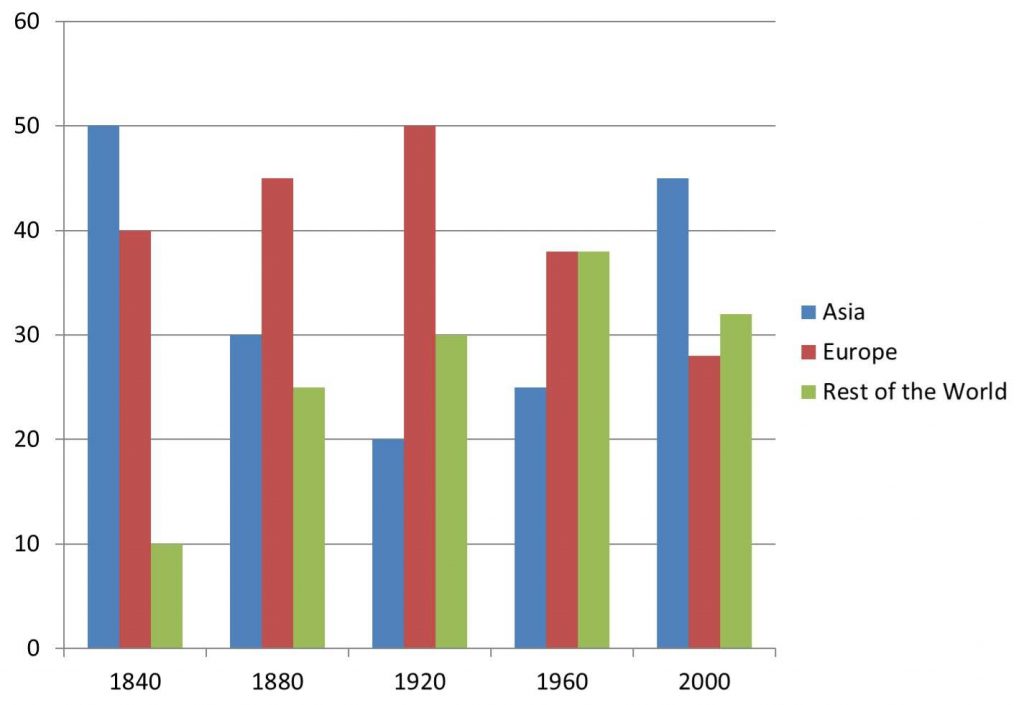
The bar graph shows the total manufacturing production in percentages Asia, Europe, and the rest of the world.
Summarise the information by selecting and reporting the main features and make comparisons where relevant.
Things you should know about Academic Writing Task 1:
- You are asked to describe information presented in graph/ table/ chart/ diagram.
- You have 20 minutes to finish the task and you have to write at least 150 words.
- If you are asked to use the information presented in the graph you must be careful not to copy it.
In Academic Writing task 1, candidates are assessed on their ability to:
- Organise, present and possibly compare data.
- Describe the stages of a process or procedure.
- Describe an object or event or sequence of events.
- Explain how something works.
Model Answer
Bar chart illustrates the percentage of total world production in terms of Asia, Europe, and the rest of the world, in total over the course of 160 years, beginning in 1840 and end in 2000.
Looking from an overall perspective, it is apparent that Asia and Europe’s numbers decline in this period. On the other hand, The rest of the world percentage steady increase and by the end it was second to Asia in production.
In 1840, Asian countries ranking first at 50%, but they registered a significant decrease by 20% in 1880. In addition, Europe’s and rest of the world’s manufacturing proportion were inclined by 5% and 15% and amounting to 45% and 25% respectively in 1880. In 1920, percentages of the manufacturing production in Europe climbed significantly to approximately 50%, whereas Asia had halved, and continued to decline to around 20%. 30% manufacturing production was recorded in the rest of the world at the same time
The pattern shifted as Asia rose precipitously/ very steeply, accounting for 25% in 1960 and about 45% in 2000. production in Europe had dropped by around 12%, while output in the rest of the world continued to increase to approximately 38%. Lastly, Europe and the rest of the world were falling back slightly to 28% and 32% in the sequence that was nearly 15% less than the production ratio of Asian countries by the end of the period.
Read More :
- The table below illustrates weekly consumption by age group of dairy products in a European country
- The charts below show the United States spending patterns between 1966 and 1996
- The charts give information about two genres/ categories of TV programs watched by men and women
- The table below shows the numbers of visitors to Ashdown Museum
- The pie charts show the electricity generated in Germany and France from all sources and renewable
The bar graph shows the total manufacturing production in percentages Asia, Europe, and the rest of the world

Bar chart illustrates the percentage of total world production in terms of Asia, Europe, and the rest of the world, in total over the course of 160 years, beginning in 1840 and end in 2000.
Looking from an overall perspective, it is apparent that Asia and Europe’s numbers decline in this period. On the other hand, The rest of the world percentage steady increase and by the end it was second to Asia in production.
In 1840, Asian countries ranking first at 50%, but they registered a significant decrease by 20% in 1880. In addition, Europe’s and rest of the world’s manufacturing proportion were inclined by 5% and 15% and amounting to 45% and 25% respectively in 1880. In 1920, percentages of the manufacturing production in Europe climbed significantly to approximately 50%, whereas Asia had halved, and continued to decline to around 20%. 30% manufacturing production was recorded in the rest of the world at the same time
The pattern shifted as Asia rose precipitously/ very steeply, accounting for 25% in 1960 and about 45% in 2000. production in Europe had dropped by around 12%, while output in the rest of the world continued to increase to approximately 38%. Lastly, Europe and the rest of the world were falling back slightly to 28% and 32% in the sequence that was nearly 15% less than the production ratio of Asian countries by the end of the period.
