IELTS Academic Writing Task 1
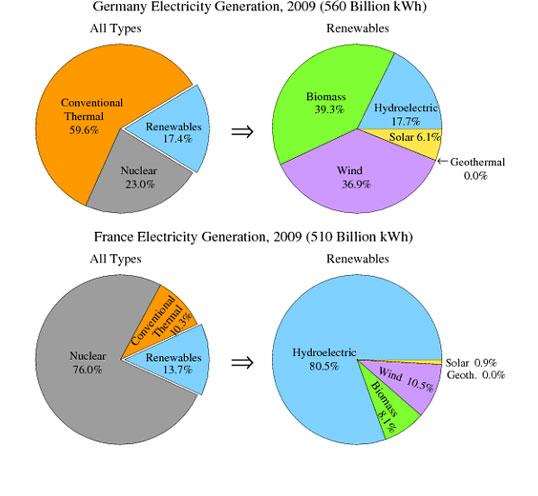
The pie charts show the electricity generated in Germany and France from all sources and renewable.
Summarise the information by selecting and reporting the main features and make comparisons where relevant.
Things you should know about Academic Writing Task 1:
- You are asked to describe information presented in graph/ table/ chart/ diagram.
- You have 20 minutes to finish the task and you have to write at least 150 words.
- If you are asked to use the information presented in the graph you must be careful not to copy it.
In Academic Writing task 1, candidates are assessed on their ability to:
- Organise, present and possibly compare data.
- Describe the stages of a process or procedure.
- Describe an object or event or sequence of events.
- Explain how something works.
Model Answer
The given pie charts depict and compare the percentage of electricity production in France and Germany from three different sources such as conventional thermal, renewable and nuclear in 2009. it is measured in billions of kWh.
Overall, it can be seen that Energy generated from a renewable source is further classified into five subcategories such as biomass, the hydroelectric, wind, solar and geothermal. Conventional thermal was the primary source in Germany, and nuclear Energy was mainly used to produce electricity in France.
To begin with Germany, a total of 560 billion kWh electricity was produced, which was 5o billion kWh more than power generated in France. Maximum Energy was produced through conventional thermal amounting to 59.6%, but France used this source only 10.3% to produce electricity. Both countries used a similar proportion of renewable sources to generate electricity. A large share of Nuclear was used in energy production, which was about three-fold of Germany’s percentage to produce power.
Furthermore, France and Germany used hydroelectric as renewable sources to 80.5% and 17.7%, respectively. The remaining 20% of electricity was generated through biomass, wind and solar in France, whereas in Germany, most of the renewable consisted of wind and biomass, totalling around 75%, which was far higher than solar (6.1%).
Read More :
- The chart shows the unemployment situation in Australia in the year 2012
- The table below gives information about UK independent films
- The chart below shows information about changes in average house prices
- The table below shows top ten countries with largest population in 2019, and how it is projected to change by 2100
- The charts below give information about the diet and general health of two groups of students


