IELTS Academic Writing Task 1
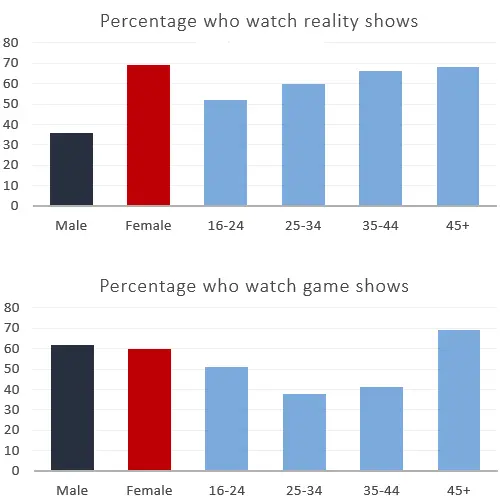
The charts give information about two genres/ categories of TV programs watched by men and women and four different age groups in Australia.
Summarise the information by selecting and reporting the main features and make comparisons where relevant.
Things you should know about Academic Writing Task 1:
- You are asked to describe information presented in graph/ table/ chart/ diagram.
- You have 20 minutes to finish the task and you have to write at least 150 words.
- If you are asked to use the information presented in the graph you must be careful not to copy it.
In Academic Writing task 1, candidates are assessed on their ability to:
- Organise, present and possibly compare data.
- Describe the stages of a process or procedure.
- Describe an object or event or sequence of events.
- Explain how something works.
Model Answer
The charts illustrate the TV programs that watched by Australian men and women and different age groups watch.
Overall, it is apparent that men tend to watch more game shows on television than women. On the other hand, The people who watch the most television are in the 45+ age group.
To begin with reality shows, In Australia, 37% of males watch Reality shows which are about half of the percentage of women watching reality shows. The ratio is inclined with age groups, 51% of 16-24 age group people and about 60% to 65% from 25 to 44 age group people watch reality shows. Most significant percentage of the 45s watch reality shows.
Furthermore, with games shows, On the other hand, almost the same percentage of men and women watch Game TV programs amounting to 61% male and 60% female. The lowest proportion of 25 to 44-year-old people are interested in games shows. Just over 50% of 16-25 year-olds prefer to watch Game shows. People over 45 years old like games programs; that’s why nearly 70% of people spend their time on Game shows in Australia.
Read More :
- The table below shows the numbers of visitors to Ashdown Museum
- The pie charts show the electricity generated in Germany and France from all sources and renewable
- The chart shows the unemployment situation in Australia in the year 2012
- The table below gives information about UK independent films
- The chart below shows information about changes in average house prices
The charts give information about two genres/ categories of TV programs watched by men and women and four different age groups in Australia.

The charts illustrate the TV programs that watched by Australian men and women and different age groups watch.
Overall, it is apparent that men tend to watch more game shows on television than women. On the other hand, The people who watch the most television are in the 45+ age group.
To begin with reality shows, In Australia, 37% of males watch Reality shows which are about half of the percentage of women watching reality shows. The ratio is inclined with age groups, 51% of 16-24 age group people and about 60% to 65% from 25 to 44 age group people watch reality shows. Most significant percentage of the 45s watch reality shows.
Furthermore, with games shows, On the other hand, almost the same percentage of men and women watch Game TV programs amounting to 61% male and 60% female. The lowest proportion of 25 to 44-year-old people are interested in games shows. Just over 50% of 16-25 year-olds prefer to watch Game shows. People over 45 years old like games programs; that’s why nearly 70% of people spend their time on Game shows in Australia.


