IELTS Academic Writing Task 1
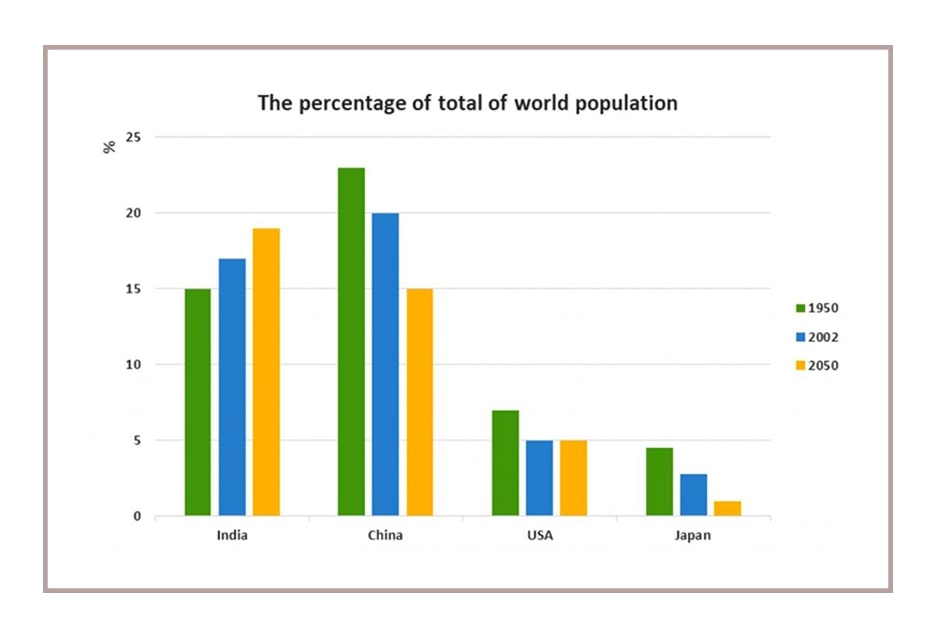
The chart below shows the percentage of whole world population in four countries from 1950 to 2000, with projections till 2050.
Summarise the information by selecting and reporting the main features and make comparisons where relevant.
Things you should know about Academic Writing Task 1:
- You are asked to describe information presented in graph/ table/ chart/ diagram.
- You have 20 minutes to finish the task and you have to write at least 150 words.
- If you are asked to use the information presented in the graph you must be careful not to copy it.
In Academic Writing task 1, candidates are assessed on their ability to:
- Organise, present and possibly compare data.
- Describe the stages of a process or procedure.
- Describe an object or event or sequence of events.
- Explain how something works.
You may like this resourses :
Model Answer :
The column graph compares the changes in the proportion of population in India, China, the USA and Japan in 1950 and 2000, and also indicates the projections for 2050. It is clear from the graph that China had the highest percentage of world population in 1950 and 2000, but estimates show that India will take the lead by 2050.
In 1950, China accounted for a little over a quarter of the world’s population. Although it decreased to a little under a quarter, it was still the highest in 2000, compared to the other three countries. It is estimated that the population of China will continue to drop and would reach approximately 19% by 2050.
India showed an opposing trend to China. The population in India in 1950 was 15%, which was considerably lower than that of China. However, the population increased moderately to 19% by 2000 and is further expected to grow and reach nearly 20%, which would be the highest among the given countries by 2050.
When it comes to the population of the USA and Japan, both showed a decrease from 1950 to 2000. It is predicted that the percentage will remain the same in the USA, whereas in Japan, the population is likely to keep falling till 2050.
Overall, Japan had the least population in the given period, and the population is expected to decrease to approximately 3% by 2050.
More Bar Graphs :


