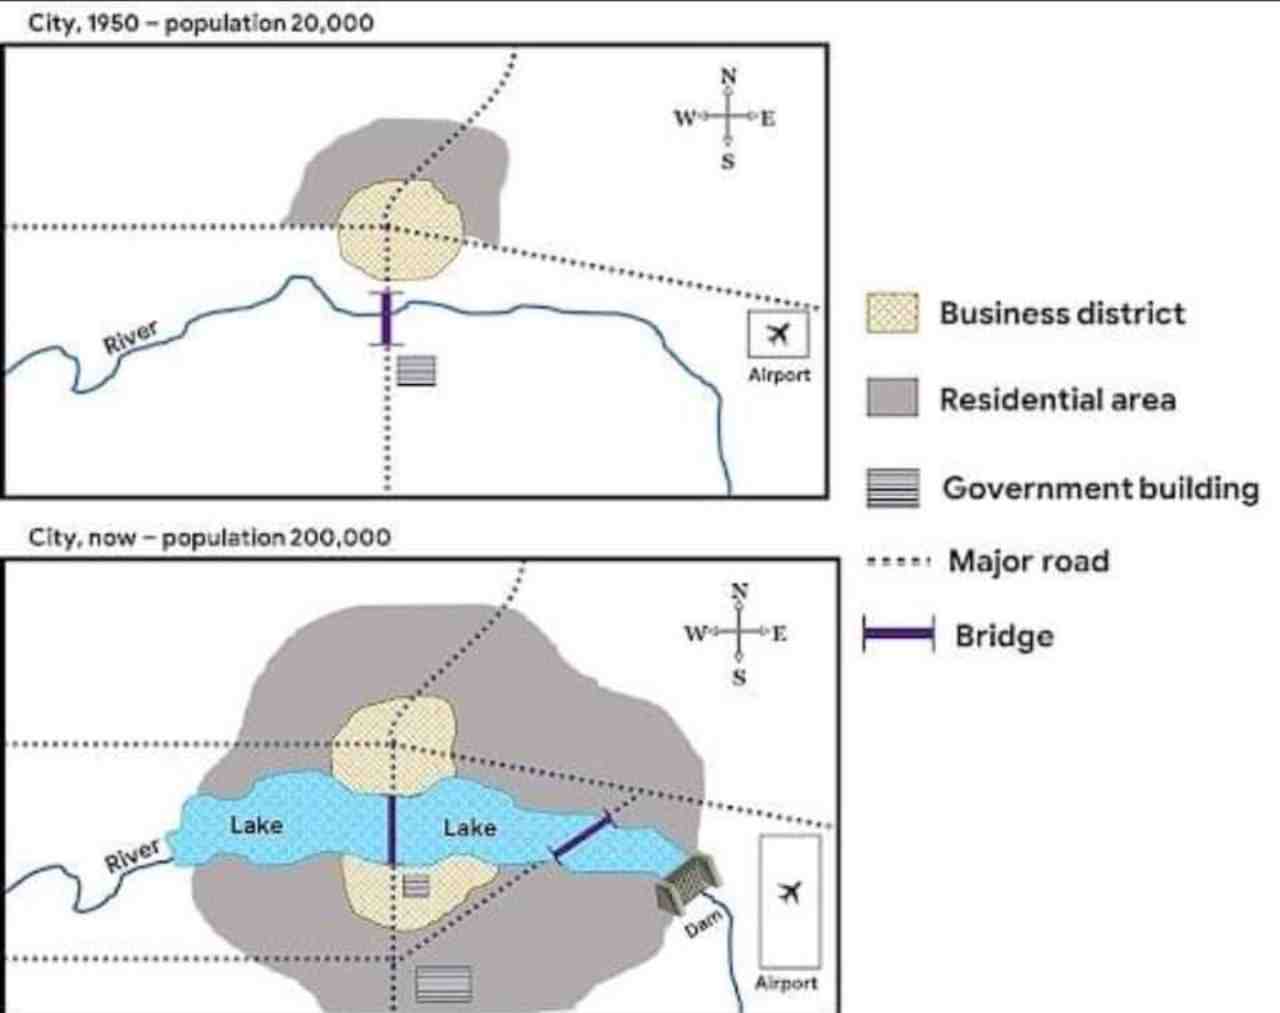
Map of a City in 1950

Writing Task
You should spend about 20 minutes on this task.
The map below shows how a city has changed since 1950.
Summarise the information by selecting and reporting the main features, and make comparisons where relevant.
Write at least 150 words.
Sample Answer
The map illustrates the transformation of a city from 1950 to the present, with significant changes in population, infrastructure, and land use.
Overall, the city has experienced dramatic urban growth, particularly in its residential and commercial zones. A large lake has been formed from a previously narrow river, and the transport and administrative infrastructure has been significantly expanded.
In 1950, the city had a population of 20,000, with residential areas limited to the north of the main east–west road. Today, the population has grown tenfold to 200,000, and housing developments now span all directions, including south of the main road, supported by new major roads.
The river that once passed through the city has been dammed, forming a long lake that stretches across the entire residential region. The business district, once small and central, has expanded to include both north and south shores of the lake. Additionally, a new bridge has been added in the east near the dam, complementing the original one. There is now a second government building in the south, and the airport to the east has more than doubled in size, indicating growth in transport facilities.