Modes of Transport for School Trips (1990 vs 2010)

Writing Task
You should spend about 20 minutes on this task.
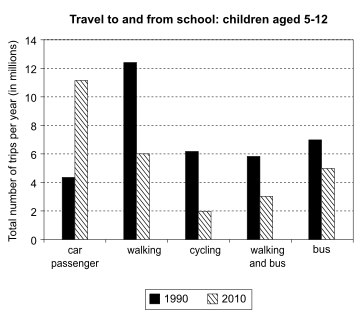
The chart below shows the number of trips made by children in one country in 1990 and 2010 to travel to and from school using different modes of transport.
Summarise the information by selecting and reporting the main features, and make comparisons where relevant.
Write at least 150 words.
Sample Answer
The chart compares the number of school trips per year made by children in 1990 and 2010 using five modes of transport.
Overall, there was a significant decline in walking and cycling, while car travel increased markedly over the period. Walking with others remained popular, though it also declined, whereas bus usage showed a modest fall.
In 1990, walking was the dominant form of travel, accounting for nearly 12 million trips, followed by walking with others at just under 7 million. Cycling was also relatively common, at about 6 million journeys. By contrast, car travel was the least used option, at roughly 4 million trips.
By 2010, the situation had reversed. Cars became the most popular mode, rising to almost 11 million trips. In contrast, walking fell sharply to around 6 million, while cycling dropped to below 3 million. Bus journeys also declined slightly, to just over 5 million.