Museums

Writing Task
You should spend about 20 minutes on this task.
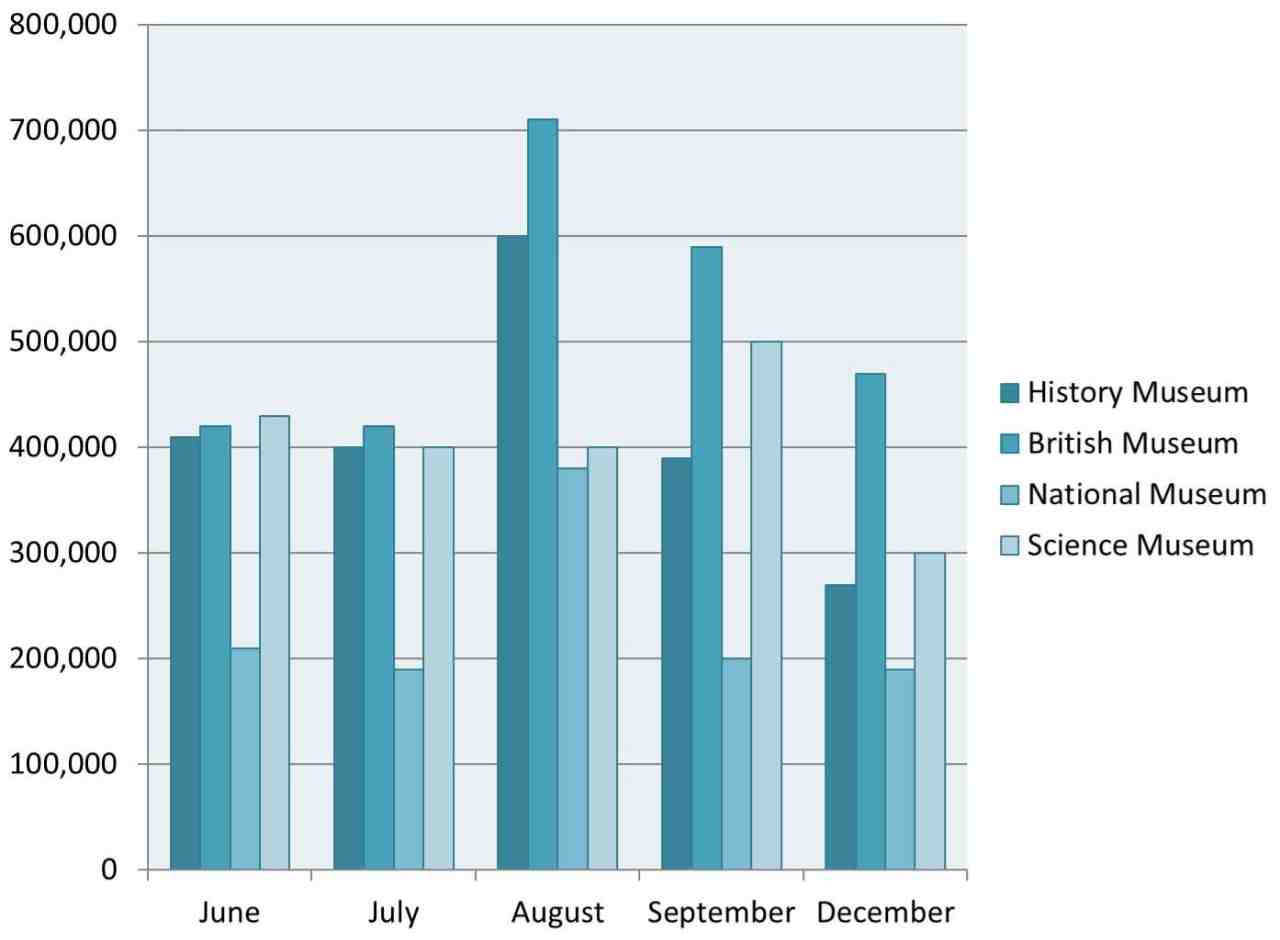
The bar chart below shows the number of visitors to four London museums between June and December.
Summarise the information by selecting and reporting the main features, and make comparisons where relevant.
Write at least 150 words.
Sample Answer
The bar chart compares the number of visitors to four London museums—the British Museum, History Museum, Science Museum, and National Museum—over a seven-month period from June to December.
Overall, the British Museum was the most popular throughout the period and the only museum to experience a net increase in visitors. In contrast, the National Museum consistently recorded the lowest attendance and showed a general downward trend.
In June, three museums had similar attendance: the Science Museum (430,000), British Museum (420,000), and History Museum (410,000), while the National Museum trailed behind at 210,000. Visitor numbers dipped for all except the British Museum in July, and then peaked in August, when the British Museum surged to 710,000 and the History Museum reached 600,000. The National Museum doubled its numbers to 380,000, while the Science Museum remained unchanged.
After August, visitor numbers dropped across most museums. The Science Museum briefly rose in September (500,000) before falling again, while the History Museum declined steadily from 390,000 to 270,000 by December. The British Museum closed the period at 470,000, still above its starting point, while the National Museum ended at just 190,000.