Comparison of Energy Production

Writing Task
You should spend about 20 minutes on this task.
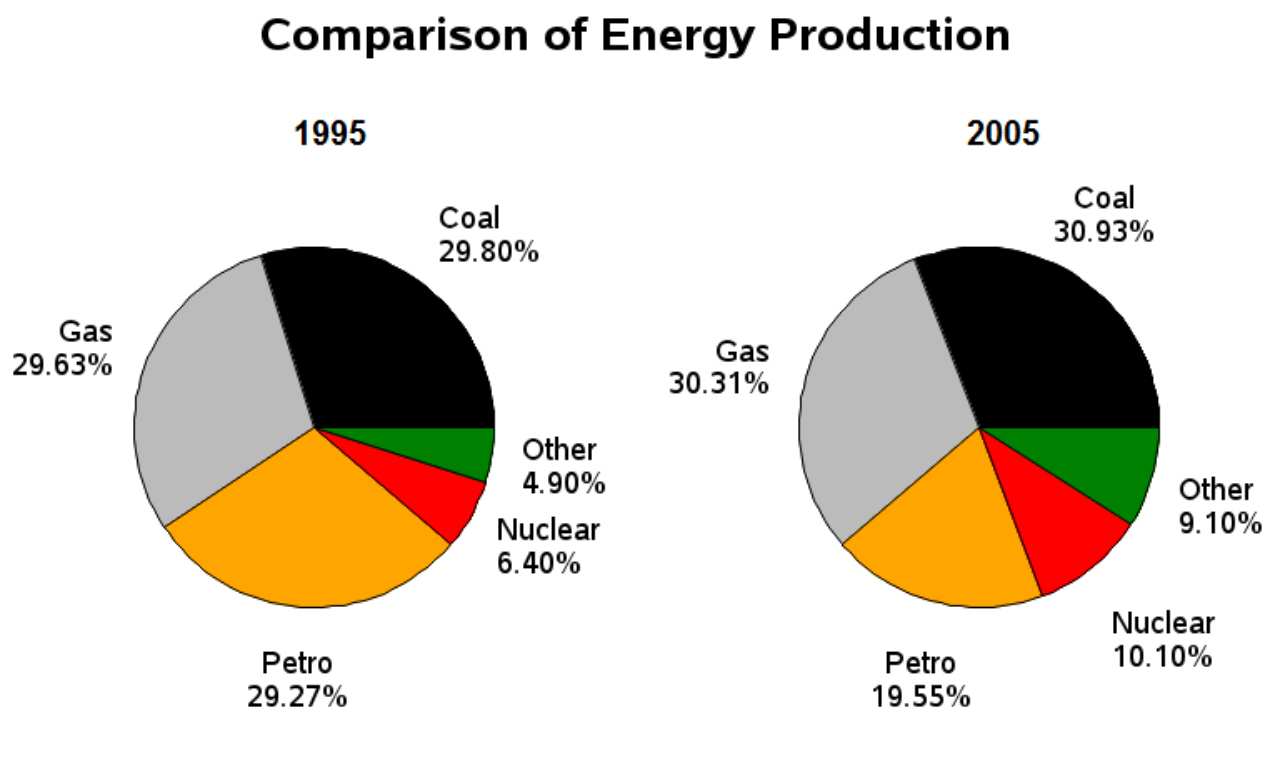
The pie charts below show information about energy production in a country in 1995 and 2005.
Summarise the information by selecting and reporting the main features, and make comparisons where relevant.
Write at least 150 words.
Sample Answer
The two pie charts illustrate the breakdown of energy production by source in a specific country for the years 1995 and 2005.
Overall, coal and gas remained the dominant sources across both years, increasing slightly in proportion. Petrol, however, saw a significant decline, while nuclear and other energy sources, though still smaller contributors, grew in share.
In 1995, the energy mix was quite balanced among coal (29.80%), gas (29.63%), and petrol (29.27%), with each contributing just under one-third of total production. The remaining sources, nuclear and other, made up 6.40% and 4.90%, respectively.
By 2005, both coal and gas saw marginal increases to 30.93% and 30.31%, while petrol dropped sharply to 19.55%, indicating a shift away from petroleum-based energy. Meanwhile, nuclear energy rose to 10.10%, and other sources nearly doubled to 9.10%, suggesting a growing diversification in energy production.