IELTS Academic Writing Task 1
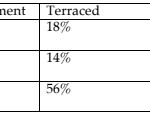
The table below shows the percentage of the population and the types of houses they live in 3 areas of a city.
Summarise the information by selecting and reporting the main features and make comparisons where relevant.
Things you should know about Academic Writing Task 1:
- You are asked to describe information presented in graph/ table/ chart/ diagram.
- You have 20 minutes to finish the task and you have to write at least 150 words.
- If you are asked to use the information presented in the graph you must be careful not to copy it.
In Academic Writing task 1, candidates are assessed on their ability to:
- Organise, present and possibly compare data.
- Describe the stages of a process or procedure.
- Describe an object or event or sequence of events.
- Explain how something works.
Model Answer
The given table compares the population of three areas of a city and types of housing such as Flat, Terraced, Semi-detached and Detached in which people prefer to live.
Overall, It is clear from the graph that despite the population of the three areas being very similar, there is a considerable difference in the choice of housing.
All three areas have a population of about 32000. In the green park area of city individuals, living/ flats are the most popular, and the ratio is amounting to more than 70%, which is three-time of South berg area and 60% more than Central area. Coming to a terraced house, 56% of the Southern area population like to live in terraced houses, but only 14% and 18% of people of Green Park area and Central area live in these types of homes, respectively.
Moreover, in the green park area, people live in semi-detached and detached types of houses, rates are equal, accounting for 5% each. Only 5% of the Southern area population live in semi-detached homes that are about 10% less than the proportion that lives in detached houses. In the Central part of a city, the people live house ratio is highest, it is 39 % which is 11% more than the proportion of people that live in semi-detached houses.
Read More :
- The cart below gives information about adults with education at high school
- The bar chart illustrates the number of people in the UK eating more than 5 portions
- The diagram details the process of making wool
- The plans below show the site of an airport now and how it will look after redevelopment next year
- The bar graph shows the total manufacturing production
The table below shows the percentage of the population and the types of houses

The given table compares the population of three areas of a city and types of housing such as Flat, Terraced, Semi-detached and Detached in which people prefer to live.
Overall, It is clear from the graph that despite the population of the three areas being very similar, there is a considerable difference in the choice of housing.
All three areas have a population of about 32000. In the green park area of city individuals, living/ flats are the most popular, and the ratio is amounting to more than 70%, which is three-time of South berg area and 60% more than Central area. Coming to a terraced house, 56% of the Southern area population like to live in terraced houses, but only 14% and 18% of people of Green Park area and Central area live in these types of homes, respectively.
Moreover, in the green park area, people live in semi-detached and detached types of houses, rates are equal, accounting for 5% each. Only 5% of the Southern area population live in semi-detached homes that are about 10% less than the proportion that lives in detached houses. In the Central part of a city, the people live house ratio is highest, it is 39 % which is 11% more than the proportion of people that live in semi-detached houses.


