IELTS Academic Writing Task 1
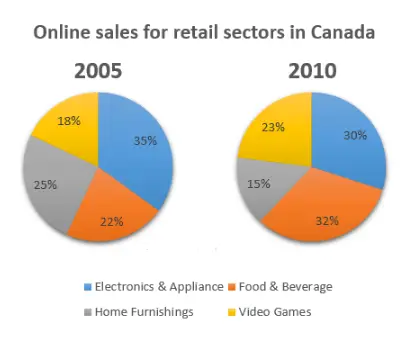
The pie chart shows the online sales for retail sectors in Canada in the year 2005 & 2010.
Summarise the information by selecting and reporting the main features and make comparisons where relevant.
Things you should know about Academic Writing Task 1:
- You are asked to describe information presented in graph/ table/ chart/ diagram.
- You have 20 minutes to finish the task and you have to write at least 150 words.
- If you are asked to use the information presented in the graph you must be careful not to copy it.
In Academic Writing task 1, candidates are assessed on their ability to:
- Organise, present and possibly compare data.
- Describe the stages of a process or procedure.
- Describe an object or event or sequence of events.
- Explain how something works.
Model Answer
The given chart compares the online sales percentage of Canada’s different retail sectors in two different years, 2005 and 2010.
Overall, it is apparent that the proportion of internet sales for each sector changed significantly in the given period.
In 2010, the online sales percentage of food and beverage was 32%, which was 10% less in 2005. Similarly, video games also followed the same trend; the proportion was rising by 5% in 2010 compared to previous years.
Furthermore, the electronics & appliance sector accounted for the majority of online sales that were 35 % in 2005, but the percentage had dropped to 3o% by 2010. The most dramatic fall was in the home furnishings retail sector. Industry boasted an impressive 25% of the total online sales in Canada in 2005. However, by 2010, the figure had fallen considerably to 15%.
Read More :
- the charts below show the main methods of transportation for people travelling to one university for work or study in 2004 and 2009
- The chart compares the number of people per household by percentage in the UK in 1981 and 2001
- The diagrams below give information about the manufacture of frozen fish pies
- The graph below shows the percentage of people in different age groups in one city
- The chart below shows the global sales (in billions of dollars) of different kinds of digital games


