IELTS Academic Writing Task 1
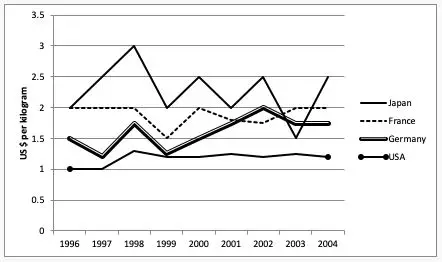
The graph below shows the price of bananas in 4 different countries from 1996 to 2004.
Summarise the information by selecting and reporting the main features and make comparisons where relevant.
Things you should know about Academic Writing Task 1:
- You are asked to describe information presented in graph/ table/ chart/ diagram.
- You have 20 minutes to finish the task and you have to write at least 150 words.
- If you are asked to use the information presented in the graph you must be careful not to copy it.
In Academic Writing task 1, candidates are assessed on their ability to:
- Organise, present and possibly compare data.
- Describe the stages of a process or procedure.
- Describe an object or event or sequence of events.
- Explain how something works.
Model Answer
The line chart depicts/compares the price of bananas over eight years from 1996 to 2004 in four different nations named Japan, France, Germany and the USA.
Overall, it is apparent that for most of the period, the price of bananas was very high in Japan, whereas the least the price was in the USA.
In 1996, the bananas were sold at similar prices in Japan and France amounting to 2 USD/kg. There was no change saw in the price of bananas for a next one and half year in France, but the price was inclined to 3 USD/kg in Japan in the same period, but it dwindled to 1.5 USD/kg and 2 USD/ kg respectively in 1999. Cost of bananas fluctuated till the end and accounted for 2.5 USD/kg in Japan and 2 USD/kg in France in 2004.
Furthermore, with Germany and the USA, 1.5 USD/kg cost was recorded in Germany that was .5 USD/kg higher than the price of bananas in the USA in 1996. Price was risen by .25USD/kg in both countries in 1998. The cost remained stable in the USA at 1.25USD/kg from 1999 to 2004, but price grew slightly to 2 USD/kg in 2002 in Germany before dropping to 1.75 USD/kg in 2004.
Read More :
- The pie chart shows the online sales for retail sectors in Canada
- The table below shows the percentage participation of women in senior management
- The chart below shows information about changes in average house prices
- The table below shows top ten countries with largest population in 2019, and how it is projected to change by 2100
- The charts below give information about the diet and general health of two groups of students

