IELTS Academic Writing Task 1
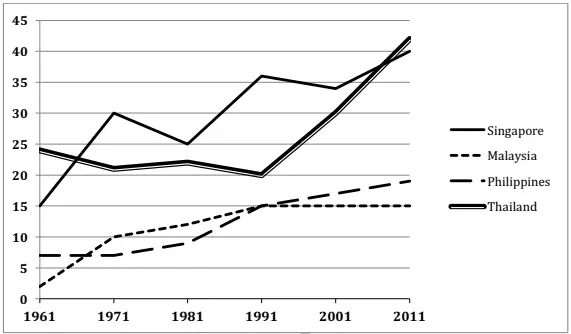
The graph below shows the percentage of 18-25 year olds in universities in four different countries.
Summarise the information by selecting and reporting the main features and make comparisons where relevant.
Things you should know about Academic Writing Task 1:
- You are asked to describe information presented in graph/ table/ chart/ diagram.
- You have 20 minutes to finish the task and you have to write at least 150 words.
- If you are asked to use the information presented in the graph you must be careful not to copy it.
In Academic Writing task 1, candidates are assessed on their ability to:
- Organise, present and possibly compare data.
- Describe the stages of a process or procedure.
- Describe an object or event or sequence of events.
- Explain how something works.
Model Answer
The line graph depicts the percentage of universities’ students of 18-25-year-olds in four different countries named Singapore, Malaysia, Philippines and Thailand from 1961 to 2011.
Overall, it is apparent that there was an increase in the proportion of students in all the given nations, but Singapore had the highest proportion of 18-25-year-olds studying at universities for the majority of the given time.
In 1961, 25% of 18-25-year-olds in Thailand was enrolled in university, and it was followed by Singapore at 15%. But, the percentage of studying at universities in the Philippines and Malaysia was below 10. From 1971 to 1991, except Thailand, the proportion of the rest of the countries increased; both Malaysia and the Philippines amounted to around 15%, and Singapore accounted for more than 35%. There was a slight decrease in the proportion from Thailand studying at universities.
Furthermore, with last decades from 1991 to 2011, the proportion of Singaporeans went down to 34% in 2001. the figure in Malaysia remained unchanged at 15% till the end. In 2011, the percentage of studying at universities stood at around 40% in Singapore and Thailand, while the figures for the Philippines was below 20%.
Read More :
- The chart below shows the average daily minimum and maximum level of two air pollutants
- The table below shows the percentage of the population and the types of houses
- The cart below gives information about adults with education at high school
- The bar chart illustrates the number of people in the UK eating more than 5 portions
- The diagram details the process of making wool
The chart below shows the average daily minimum and maximum level of two air pollutants

The line graph depicts the percentage of universities’ students of 18-25-year-olds in four different countries named Singapore, Malaysia, Philippines and Thailand from 1961 to 2011.
Overall, it is apparent that there was an increase in the proportion of students in all the given nations, but Singapore had the highest proportion of 18-25-year-olds studying at universities for the majority of the given time.
In 1961, 25% of 18-25-year-olds in Thailand was enrolled in university, and it was followed by Singapore at 15%. But, the percentage of studying at universities in the Philippines and Malaysia was below 10. From 1971 to 1991, except Thailand, the proportion of the rest of the countries increased; both Malaysia and the Philippines amounted to around 15%, and Singapore accounted for more than 35%. There was a slight decrease in the proportion from Thailand studying at universities.
Furthermore, with last decades from 1991 to 2011, the proportion of Singaporeans went down to 34% in 2001. the figure in Malaysia remained unchanged at 15% till the end. In 2011, the percentage of studying at universities stood at around 40% in Singapore and Thailand, while the figures for the Philippines was below 20%.

