IELTS Academic Writing Task 1
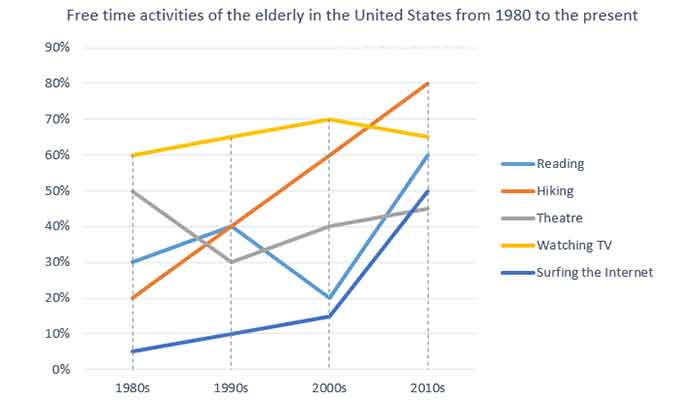
The graph below shows how elderly people in the united states spent their free time between 1980 and 2010.
Summarise the information by selecting and reporting the main features and make comparisons where relevant.
Things you should know about Academic Writing Task 1:
- You are asked to describe information presented in graph/ table/ chart/ diagram.
- You have 20 minutes to finish the task and you have to write at least 150 words.
- If you are asked to use the information presented in the graph you must be careful not to copy it.
In Academic Writing task 1, candidates are assessed on their ability to:
- Organise, present and possibly compare data.
- Describe the stages of a process or procedure.
- Describe an object or event or sequence of events.
- Explain how something works.
Model Answer :
The line chart depicts the different types of activities which grey-haired people have done in their spare time, covering a period from 1980 to 2010.
Overall, it can see that hiking is the event which liked by most of the older adults and its popularity increased with time while older people were less interested in theater.
To begin with surfing the internet which was least popular in first 20 years amounting in between 5% to 15%. The ratio suddenly increased in the last decade and touched its highest point recorded as 50%. The next activity was at the theater. 50% of older people spend their free time in the theater in 1980, but it dwindled by 20% after a decade before rose to about 45% last year.
Furthermore with the rest of the activities, older people took more interest in reading rather than hiking in 1980 amounting to 30% and 20% respectively but an equal proportion of people recorded in the 1990s. After that people’s ratio who were interested in reading decreased by 20% while hiking percentage inclined by 20% after a decade. 60% older adults spend their leisure time in reading, but hiking ratio touched its peak point in the last year. Watching TV was all-time famous activity recorded 60% in the begging, which was increased to 70% in 2000 but declined by 5% in last year.
Read more related post :
- The table below shows the salaries of secondary/high school teachers in 2009
- The chart below shows the value of one country’s exports in various categories during 2015 and 2016
- The table below shows the number of medals won by the top ten countries in the London 2012 Olympic games.
- The diagram illustrates how steel rods are manufactured in the furniture industry.


