IELTS Academic Writing Task 1
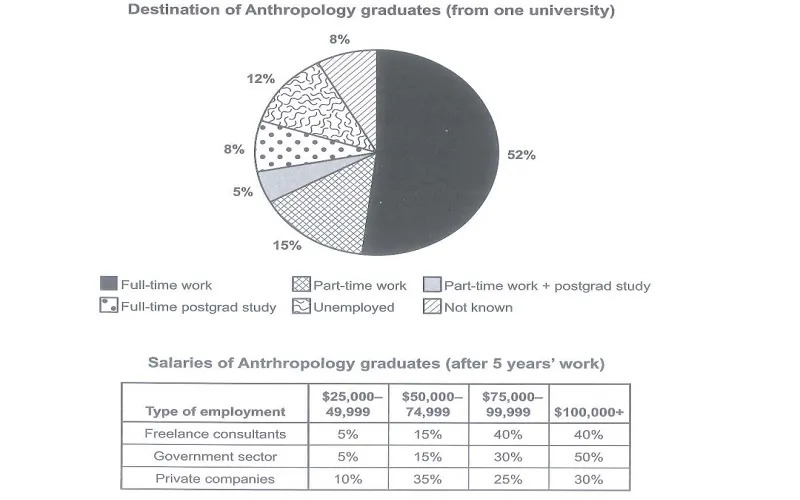
The chart below shows what Anthropology graduates from one university did after finishing their undergraduate degree courses. The table shows the salaries of the anthropologists in work after five years.
Summarise the information by selecting and reporting the main features and make comparisons where relevant.
Things you should know about Academic Writing Task 1:
- You are asked to describe information presented in graph/ table/ chart/ diagram.
- You have 20 minutes to finish the task and you have to write at least 150 words.
- If you are asked to use the information presented in the graph you must be careful not to copy it.
In Academic Writing task 1, candidates are assessed on their ability to:
- Organise, present and possibly compare data.
- Describe the stages of a process or procedure.
- Describe an object or event or sequence of events.
- Explain how something works.
Model Answer
The pie chart depicts the initial job of Anthropology( the study of peoples, history, and culture) for students after graduation and the table illustrates their salaries after 5 years of work in different sectors.
Overall, most graduates took a full-time job, followed by part-time jobs. unemployment. graduate study or unknown, and finally part-time work together with graduate study. The common salaries tended to be a lot better for freelance specialists than the ones running within side the authorities and personal companies, though there had been many authorities employees within side the maximum earnings bracket.
To begin with the pie chart, 52% of graduates were employed full-time. only 15% of graduates were employed part-time, which was 3% more than the unemployed stood at 12%. 8% were categorised as unknown, 8% seeking full-time further education, and finally, 5% were doing part-time work and higher education study together.
Moving to their salaries, 80 per cent of the freelance consultants earned at least $75,000, half of whom were in the highest salary range of more than $100.000. Government employees displayed generally the same trend with identical figures at the two lowest pay bands. 30% in the $75,000 to $99,999 range, and 50% earning over a hundred thousand dollars a year. The proportions of the freelance consultants and government employees who were in the lowest salary bracket of $25,000 to $49,999 both stood at only 5 per cent, versus 10 per cent for those employed in the private sector. Private industry salaries different overall with 10% in the lowest income range. a stand out 35% earning $50,000 to $74.999. while 25% and 30% of graduates made $75,000 — $99,999 and $100,000+, respectively.
Read More :
- The diagram below shows the production of steam using a gas cooled nuclear reactor
- The chart below show a percentage of five kinds of books sold bookseller
- The chart below show changes in the proportion of energy produced from different resources in a country in 1985 and 2003
- The table and pie chart illustrate populations in Australia, according to different nationalities
- The maps below show Pancha Village in 2005 and 2015
The chart below shows what Anthropology graduates from one university did after finishing their undergraduate degree courses. The table shows the salaries of the anthropologists in work after five years.

The pie chart depicts the initial job of Anthropology( the study of peoples, history, and culture) for students after graduation and the table illustrates their salaries after 5 years of work in different sectors.
Overall, most graduates took a full-time job, followed by part-time jobs. unemployment. graduate study or unknown, and finally part-time work together with graduate study. The common salaries tended to be a lot better for freelance specialists than the ones running within side the authorities and personal companies, though there had been many authorities employees within side the maximum earnings bracket.
To begin with the pie chart, 52% of graduates were employed full-time. only 15% of graduates were employed part-time, which was 3% more than the unemployed stood at 12%. 8% were categorised as unknown, 8% seeking full-time further education, and finally, 5% were doing part-time work and higher education study together.
Moving to their salaries, 80 per cent of the freelance consultants earned at least $75,000, half of whom were in the highest salary range of more than $100.000. Government employees displayed generally the same trend with identical figures at the two lowest pay bands. 30% in the $75,000 to $99,999 range, and 50% earning over a hundred thousand dollars a year. The proportions of the freelance consultants and government employees who were in the lowest salary bracket of $25,000 to $49,999 both stood at only 5 per cent, versus 10 per cent for those employed in the private sector. Private industry salaries different overall with 10% in the lowest income range. a stand out 35% earning $50,000 to $74.999. while 25% and 30% of graduates made $75,000 — $99,999 and $100,000+, respectively.

