IELTS Academic Writing Task 1
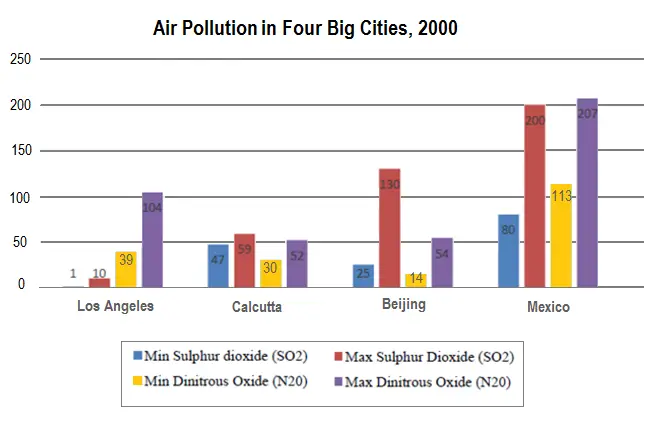
The chart below shows the average daily minimum and maximum level of two air pollutants in four big cities in 2000.
Summarise the information by selecting and reporting the main features and make comparisons where relevant.
Things you should know about Academic Writing Task 1:
- You are asked to describe information presented in graph/ table/ chart/ diagram.
- You have 20 minutes to finish the task and you have to write at least 150 words.
- If you are asked to use the information presented in the graph you must be careful not to copy it.
In Academic Writing task 1, candidates are assessed on their ability to:
- Organise, present and possibly compare data.
- Describe the stages of a process or procedure.
- Describe an object or event or sequence of events.
- Explain how something works.
Model Answer
The bar chart illustrates peak and minimum levels of Sulphur dioxide (502) and Dinitrous oxide (NO2), two air pollutants, in four cities, namely Los Angeles, Calcutta, Beijing and Mexico, in 2000. The figures are measured in micrograms per cubic metre.
Overall, the average presence of these two air polluting ingredients is much higher in Mexico than in the other three cities.
To begin with, the minimum level of SO2 in Los Angeles amounted to 1 microgram per cubic meter, nine micrograms less than its maximum level. The difference was increased in both levels in Calcutta, accounting for 47 micrograms and 59 micrograms per cubic meter, respectively. The minimum level of pollution in Mexico generated by SO2 was 55 micrograms more than the level of SO2 in Beijing, but the maximum range went as high as 130 in Beijing, and The presence of this air pollutant reached 200 in Mexico.
Furthermore, with N20, the second air polluting material, Dinitrous oxide, on average, found more in Mexico. The minimum level of N20 in Mexico was more than 110, which was almost ten times higher than that of Beijing and approximately 75 micrograms per cubic meter more elevated than that of Calcutta and Los Angeles. The upper level of N20 in Los Angeles was higher than N20 in Calcutta and Beijing, but it was about half of the N20 level in Mexico.
Read More :
- The table below shows the percentage of the population and the types of houses
- The cart below gives information about adults with education at high school
- The bar chart illustrates the number of people in the UK eating more than 5 portions
- The diagram details the process of making wool
- The plans below show the site of an airport now and how it will look after redevelopment next year
The chart below shows the average daily minimum and maximum level of two air pollutants

The bar chart illustrates peak and minimum levels of Sulphur dioxide (502) and Dinitrous oxide (NO2), two air pollutants, in four cities, namely Los Angeles, Calcutta, Beijing and Mexico, in 2000. The figures are measured in micrograms per cubic metre.
Overall, the average presence of these two air polluting ingredients is much higher in Mexico than in the other three cities.
To begin with, the minimum level of SO2 in Los Angeles amounted to 1 microgram per cubic meter, nine micrograms less than its maximum level. The difference was increased in both levels in Calcutta, accounting for 47 micrograms and 59 micrograms per cubic meter, respectively. The minimum level of pollution in Mexico generated by SO2 was 55 micrograms more than the level of SO2 in Beijing, but the maximum range went as high as 130 in Beijing, and The presence of this air pollutant reached 200 in Mexico.
Furthermore, with N20, the second air polluting material, Dinitrous oxide, on average, found more in Mexico. The minimum level of N20 in Mexico was more than 110, which was almost ten times higher than that of Beijing and approximately 75 micrograms per cubic meter more elevated than that of Calcutta and Los Angeles. The upper level of N20 in Los Angeles was higher than N20 in Calcutta and Beijing, but it was about half of the N20 level in Mexico.


