IELTS Academic Writing Task 1
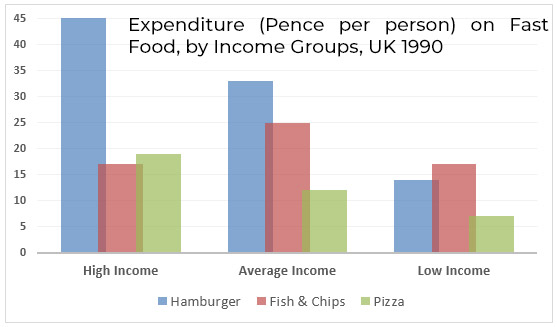
The chart below shows the amount of money per week spent on fast foods in Britain.
Summarise the information making comparisons where relevant.
Things you should know about Academic Writing Task 1:
- You are asked to describe information presented in graph/ table/ chart/ diagram.
- You have 20 minutes to finish the task and you have to write at least 150 words.
- If you are asked to use the information presented in the graph you must be careful not to copy it.
In Academic Writing task 1, candidates are assessed on their ability to:
- Organise, present and possibly compare data.
- Describe the stages of a process or procedure.
- Describe an object or event or sequence of events.
- Explain how something works.
Model Answer :
The bar chart illustrates/ compare the weekly expenditure of people on three fast food items in Britain in 1990.
Overall, expenditure on fast food based on people’s income which divided into three categories. High and average income people mostly consumed hamburger, whereas low-income people preferred fish and chips.
To begin with high-income people, and they spent more money on hamburger which was about twice of fish and chips and pizza, Moreover, with Average income people. They also spent the maximum amount of their income on hamburger which was about 8 pence more than the money they spent on fish and chips and about double the pizza.
Furthermore, with low-income people, they like fish and chips as compare to other fast food items, so that is why they spent 17 pence on it and rest items(hamburger and pizza) amounting for 14 pence and about 7 pence respectively.
Read more related post :
- The chart below shows information about the challenges people face when they go to live in other countries
- The bar chart below shows the average hours of housework done by women (unemployed, part time employed and full time employed) and full-time working men.


