IELTS Academic Writing Task 1
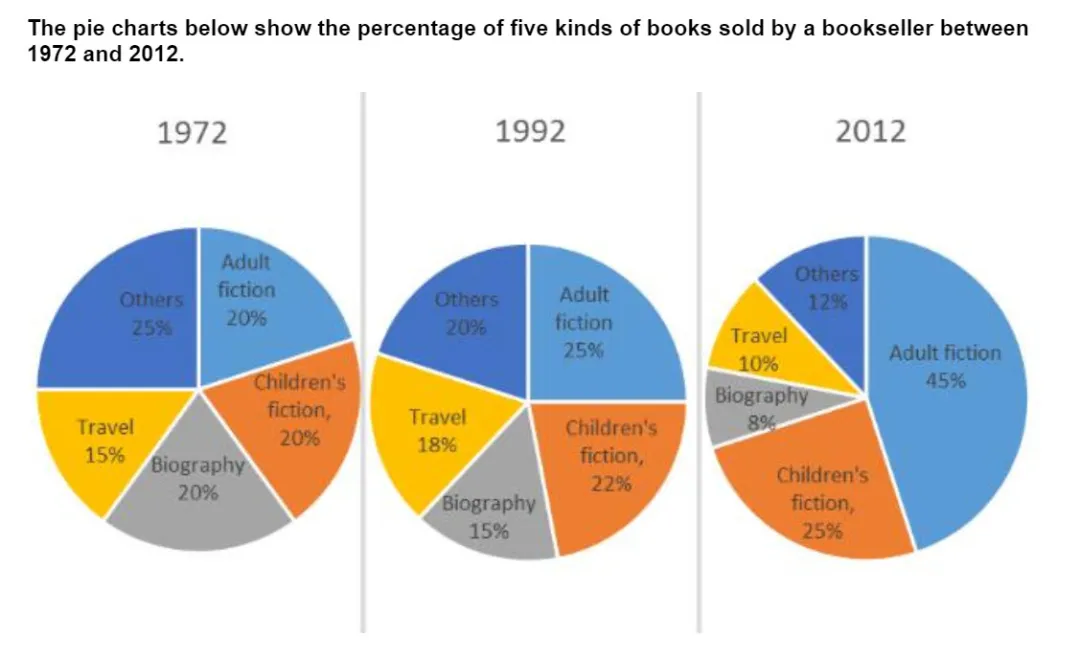
The chart below show a percentage of five kinds of books sold bookseller between 1972 to 2012.
Summarise the information by selecting and reporting the main features and make comparisons where relevant.
Things you should know about Academic Writing Task 1:
- You are asked to describe information presented in graph/ table/ chart/ diagram.
- You have 20 minutes to finish the task and you have to write at least 150 words.
- If you are asked to use the information presented in the graph you must be careful not to copy it.
In Academic Writing task 1, candidates are assessed on their ability to:
- Organise, present and possibly compare data.
- Describe the stages of a process or procedure.
- Describe an object or event or sequence of events.
- Explain how something works.
Model Answer
The pie charts depict how many books were sold by a bookseller between 1972 and 2012. Books were divided into different types.
Overall, it is apparent that adult fiction (stories and novels) became by far the most popular type at the expense of the genres which declined in popularity (other types of books, biography, and travel). Interest in children’s fiction also increased.
Since 1972, bookstores sold the same amount of adult fiction, children’s fiction, and biographical books. In addition another led by 25%. This was about 10% more than travel books, which stood at 15%. Twenty years later, adult fiction, children’s fiction, and travel increased by 5%, 2% and 3%, respectively, but biographies decreased by 5%.
Furthermore, with the final year, adult fiction grew a lot to 45%, and children’s fiction increased a little to 25%. Biographical books and travel books fell by about 8%, while others ended at 12%.
Read More :
- The chart below show changes in the proportion of energy produced from different resources in a country in 1985 and 2003
- The table and pie chart illustrate populations in Australia, according to different nationalities
- The maps below show Pancha Village in 2005 and 2015
- The average spending on shopping on the internet per person
- The line chart shows average attendance at the cinema among various age groups in the US from 2000
The chart below show a percentage of five kinds of books sold bookseller between 1972 to 2012.

The pie charts depict how many books were sold by a bookseller between 1972 and 2012. Books were divided into different types.
Overall, it is apparent that adult fiction (stories and novels) became by far the most popular type at the expense of the genres which declined in popularity (other types of books, biography, and travel). Interest in children’s fiction also increased.
Since 1972, bookstores sold the same amount of adult fiction, children’s fiction, and biographical books. In addition another led by 25%. This was about 10% more than travel books, which stood at 15%. Twenty years later, adult fiction, children’s fiction, and travel increased by 5%, 2% and 3%, respectively, but biographies decreased by 5%.
Furthermore, with the final year, adult fiction grew a lot to 45%, and children’s fiction increased a little to 25%. Biographical books and travel books fell by about 8%, while others ended at 12%.


