IELTS Academic Writing Task 1
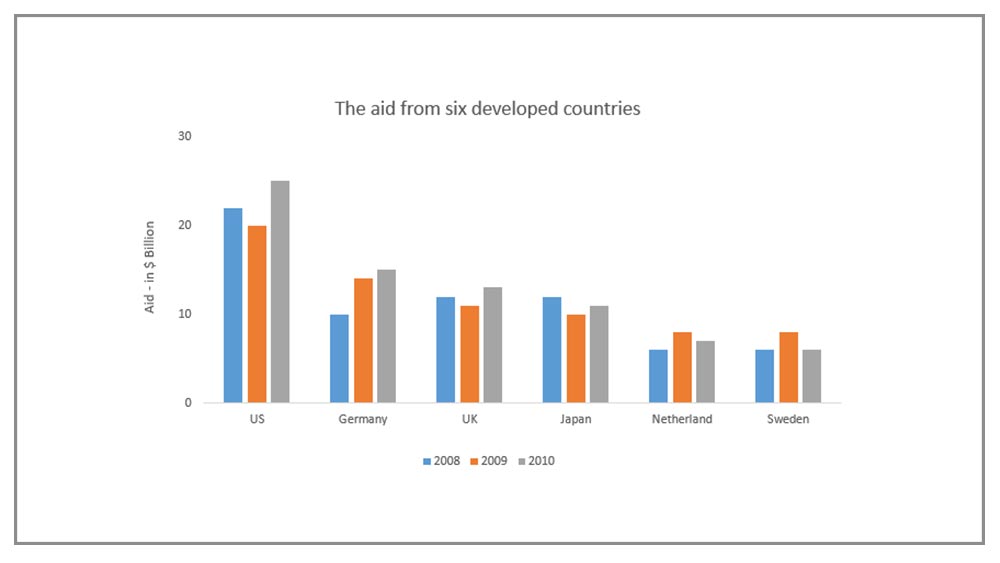
The chart below shows the aid from six developed countries to developing countries from 2008-2010.
Summarize the information by selecting and reporting the main features, and make comparisons where relevant.
Things you should know about Academic Writing Task 1:
- You are asked to describe information presented in graph/ table/ chart/ diagram.
- You have 20 minutes to finish the task and you have to write at least 150 words.
- If you are asked to use the information presented in the graph you must be careful not to copy it.
In Academic Writing task 1, candidates are assessed on their ability to:
- Organise, present and possibly compare data.
- Describe the stages of a process or procedure.
- Describe an object or event or sequence of events.
- Explain how something works.
Model answer :-
The given column graph illustrates the amount of aid given by six developed countries from 2008 to 2010, measured in billions of dollars.
The US provided the most aid in all three years and despite a slight drop in 2009 from 22 to 20 billion dollars in 2009, the figure rose to $25 billion in 2010. Germany, UK and Japan, were other three major donors, with figures ranging between 10 and 15 billion dollars. It is interesting to note that Germany increased its aid continuously over the years, but the aid from the other two showed fluctuations. The aid from Netherlands and Sweden was always under $10 billion, yet the three years saw similar changes in the figures.
Overall, the US contributed the most in supporting the developing world. whilst the aids of most countries fluctuated in three years, Germany was the only country with consistent increases.
More Bar Graphs :
- The chart below shows the percentage of adults of different age groups in the UK who used the Internet everyday from 2003-2006.
- The chart below shows the expenditure on three categories among different age groups of residents in the UK in 2004.
- The chart below shows the percentage of whole world population in four countries from 1950 to 2000, with projections till 2050.

